Did you know?
Ever since its inception Bitcoin’s trust-minimizing consensus has been enabled by its proof-of-work algorithm. The machines performing the “work” are consuming huge amounts of energy while doing so. The Bitcoin Energy Consumption Index was created to provide insight into this amount, and raise awareness on the unsustainability of the proof-of-work algorithm.
Note that the Index contains the aggregate of Bitcoin and Bitcoin Cash (other forks of the Bitcoin network are not included). A separate index was created for Ethereum, which can be found here.
What kind of work are miners performing?
New sets of transactions (blocks) are added to Bitcoin’s blockchain roughly every 10 minutes by so-called miners. While working on the blockchain these miners aren’t required to trust each other. The only thing miners have to trust is the code that runs Bitcoin. The code includes several rules to validate new transactions. For example, a transaction can only be valid if the sender actually owns the sent amount. Every miner individually confirms whether transactions adhere to these rules, eliminating the need to trust other miners.
The trick is to get all miners to agree on the same history of transactions. Every miner in the network is constantly tasked with preparing the next batch of transactions for the blockchain. Only one of these blocks will be randomly selected to become the latest block on the chain. Random selection in a distributed network isn’t easy, so this is where proof-of-work comes in. In proof-of-work, the next block comes from the first miner that produces a valid one. This is easier said than done, as the Bitcoin protocol makes it very difficult for miners to do so. In fact, the difficulty is regularly adjusted by the protocol to ensure that all miners in the network will only produce one valid block every 10 minutes on average. Once one of the miners finally manages to produce a valid block, it will inform the rest of the network. Other miners will accept this block once they confirm it adheres to all rules, and then discard whatever block they had been working on themselves. The lucky miner gets rewarded with a fixed amount of coins, along with the transaction fees belonging to the processed transactions in the new block. The cycle then starts again.
The process of producing a valid block is largely based on trial and error, where miners are making numerous attempts every second trying to find the right value for a block component called the “nonce“, and hoping the resulting completed block will match the requirements (as there is no way to predict the outcome). For this reason, mining is sometimes compared to a lottery where you can pick your own numbers. The number of attempts (hashes) per second is given by your mining equipment’s hashrate. This will typically be expressed in Gigahash per second (1 billion hashes per second).
Sustainability
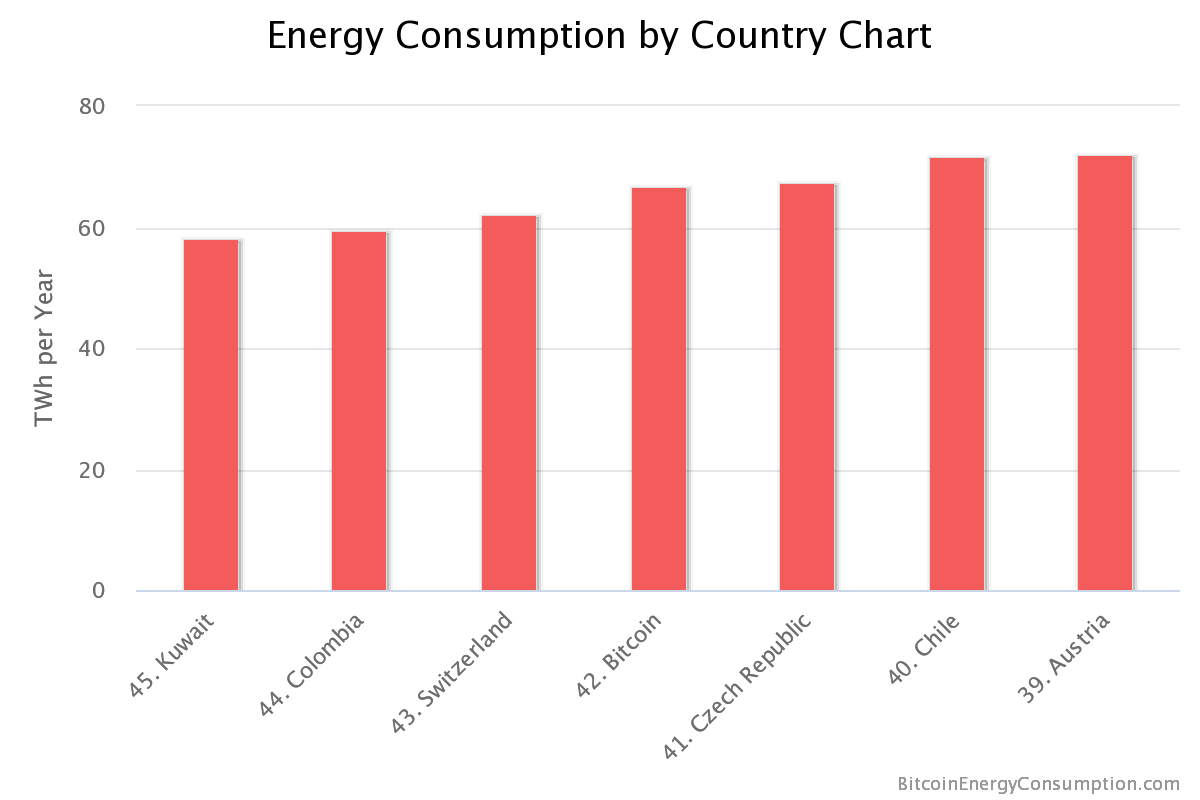
The continuous block mining cycle incentivizes people all over the world to mine Bitcoin. As mining can provide a solid stream of revenue, people are very willing to run power-hungry machines to get a piece of it. Over the years this has caused the total energy consumption of the Bitcoin network to grow to epic proportions, as the price of the currency reached new highs. The entire Bitcoin network now consumes more energy than a number of countries, based on a report published by the International Energy Agency. If Bitcoin was a country, it would rank as shown below.
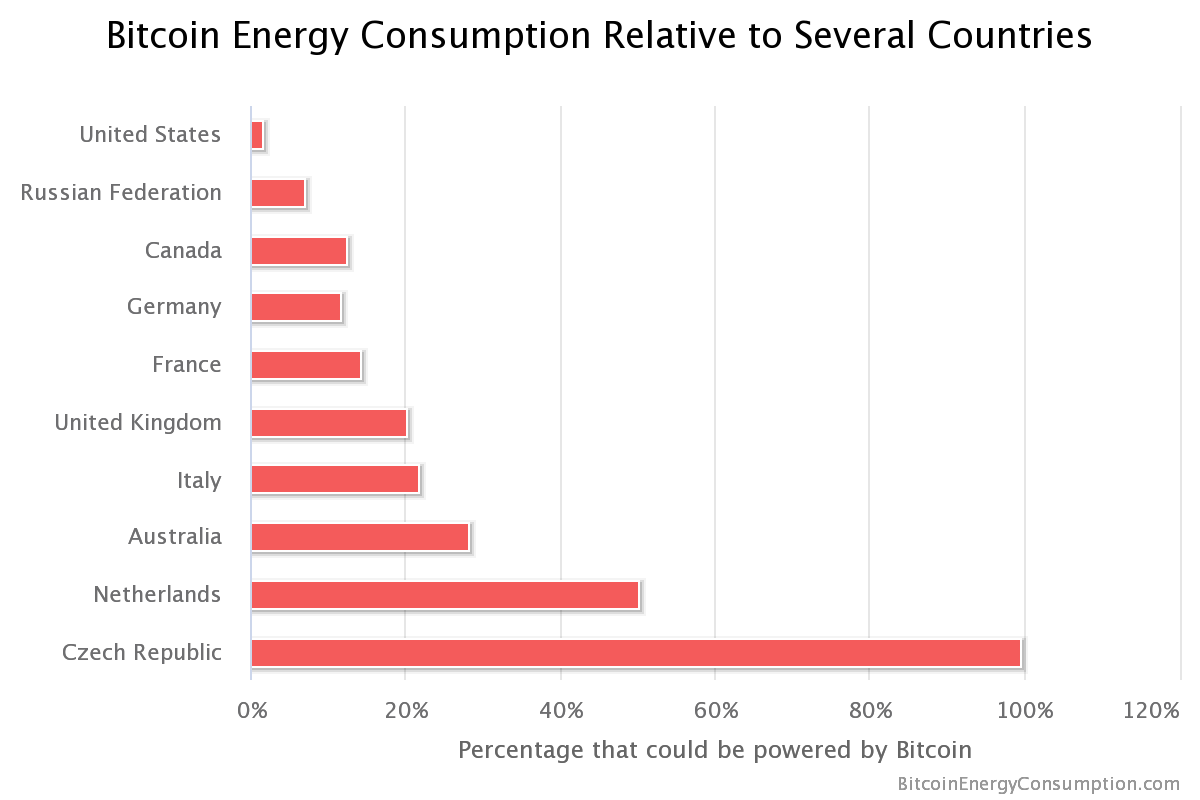
Apart from the previous comparison, it also possible to compare Bitcoin’s energy consumption to some of the world’s biggest energy consuming nations. The result is shown hereafter.
Carbon footprint
Bitcoin’s biggest problem is perhaps not even its massive energy consumption, but the fact most mining facilties in Bitcoin’s network are located in regions (primarily in China) that rely heavily on coal-based power (either directly or for the purpose of load balancing). To put it simply: “coal is fueling Bitcoin” (Stoll, 2019).
Locating miners
Determining the exact carbon impact of the Bitcoin network has been a challenge for years. Not only does one need to know the power requirement of the Bitcoin network, but one also need to know where this power is coming from. The location of miners is a key ingredient to know how dirty or how clean the power is that they are using.
Just like it’s not easy to find out what machines are active in the Bitcoin network, determining location isn’t an easy feat either. Initially the only information available to this end was the common belief that the majority of miners were located in China. Since we know the average emission factor of the Chinese grid (around 700 grams of carbon dioxide equivalent per kilowatt-hour), this can be used for a very rough approximation of the carbon intensity of the power used for Bitcoin mining. Assuming that 70% of Bitcoin mining is taking place in China, and that 30% of mining is completely clean, this yields a weighted average carbon intensity of 490 gCO2eq/kWh. This number can subsequently be applied to a power consumption estimate of the Bitcoin network to determine its carbon footprint.
A more detailed estimate
Later on, more granular information became available in the Global Cryptocurrency Benchmarking Study by Garrick Hileman and Michel Rauchs from 2017. In this study, they identified facilities representing roughly half of the entire Bitcoin hash rate, with a total (lower bound) consumption of 232 megawatts. Chinese mining facilities were responsible for about half of this, with a lower bound consumption of 111 megawatts. This information can be used to get a more accurate idea of the carbon emission factor in grams of carbon dioxide equivalent per kilowatt-hour (gCO2eq/kWh) that applies to the electricity used for mining.
The table below features a breakdown of the energy consumption of the mining facilities surveyed by Hileman and Rauchs. By applying the emission factors of the respective country’s grid, we find that the Bitcoin network had a weighted average carbon intensity of 475 gCO2eq per kWh consumed. (This number is currently applied to determine the carbon footprint of the Bitcoin network based on the Bitcoin Energy Consumption Index.)
| Location | Power consumption (megawatts) | % of surveyed facilities | Carbon intensity (gCO2eq/kWh) |
|---|---|---|---|
| China | 111 | 47.60 | 711 |
| Georgia | 60 | 25.80 | 231 |
| US | 27 | 11.60 | 489 |
| Canada | 18 | 7.70 | 158 |
| Sweden | 10 | 4.30 | 13 |
| Iceland | 5 | 2.10 | 0 |
| Estonia | 2 | 0.90 | 793 |
| Total / Weighed Average | 233 | 100.00 | 475 |
Rauchs et al. released a similar study one year later. In the second study, Rauchs et al. identified cryptocurrency mining facilities with a total capacity of 1.7 gigawatts. According to their own estimates, all cryptocurrency mining facilities (for the top-6 cryptocurrencies) were running on 5.9 to 12.7 gigawatts. As such, they cover significantly less data than before, while Bitcoin is also making up a smaller part of this data. Even so, the overall trend appears to be little change in the localization of miners.
Breakdown of regional carbon intensity
One can argue that specific locations in the listed countries may offer less carbon intense power. In 2018 Bitcoin company Coinshares suggested that the majority of Chinese mining facilities were located in Sichuan province, using cheap hydropower for mining Bitcoin. Now, even though there is plenty of reason to criticize this report, it is worth investigating what it would mean if their statement was true.
One might assume that the use of hydropower implies that the Bitcoin network has a relatively low carbon footprint. As it turns out, this would be a rather dangerous assumption. The main challenge here is that the production of hydropower (or renewable energy in general) is far from constant. In Sichuan specifically the average power generation capacity during the wet season is three times that of the dry season. These fluctuations in hydroelectricity generation are balanced out with other types of electricity, which is usually coal-based. The carbon emission factor of purchased electricity in Sichuan therefore ranges from 265 to 579 gCO2/kWh. This is nowhere near the emission factor of a grid like the one in Sweden, which is really fuelled mostly by nuclear and hydroelectric power. The carbon emission factor of the Swedish grid is 13 gCO2/kWh.
In a new study titled “The Carbon Footprint of Bitcoin” (Stoll et al. 2019) properly account for these regional differences (while also introducing a new method to localize miners based on IP-addresses), but still find a weighted average carbon intensity of 480-500 gCO2eq per kWh for the entire Bitcoin network (in line with previous and more rough estimations).
Other concerns
While renewables are an intermittent source of energy, Bitcoin miners have a constant energy requirement. A Bitcoin ASIC miner will, once turned on, not be switched off until it either breaks down or becomes unable to mine Bitcoin at a profit. Because of this, Bitcoin miners increase both the baseload demand on a grid, as well as the need for alternative (fossil-fuel based) energy sources to meet this demand when renewable energy production is low. In the worst case scenario, the presence of Bitcoin miners may thus provide an incentive for the construction of new coal-based power plants, or reopening existing ones. This impact would be even harder to quantify.
Further substantiation on why Bitcoin and renewable energy make for the worst match can be found in the peer-reviewed academic article “Renewable Energy Will Not Solve Bitcoin’s Sustainability Problem” featured on Joule.
Comparing Bitcoin’s energy consumption to other payment systems
To put the energy consumed by the Bitcoin network into perspective we can compare it to another payment system like VISA for example. According to VISA, the company consumed a total amount of 674,922 Gigajoules of energy (from various sources) globally for all its operations. This means that VISA has an energy need equal to that of around 17,000 U.S. households. We also know VISA processed 111.2 billion transactions in 2017. With the help of these numbers, it is possible to compare both networks and show that Bitcoin is extremely more energy intensive per transaction than VISA (note that the chart below compares a single Bitcoin transaction to 100,000 VISA transactions).
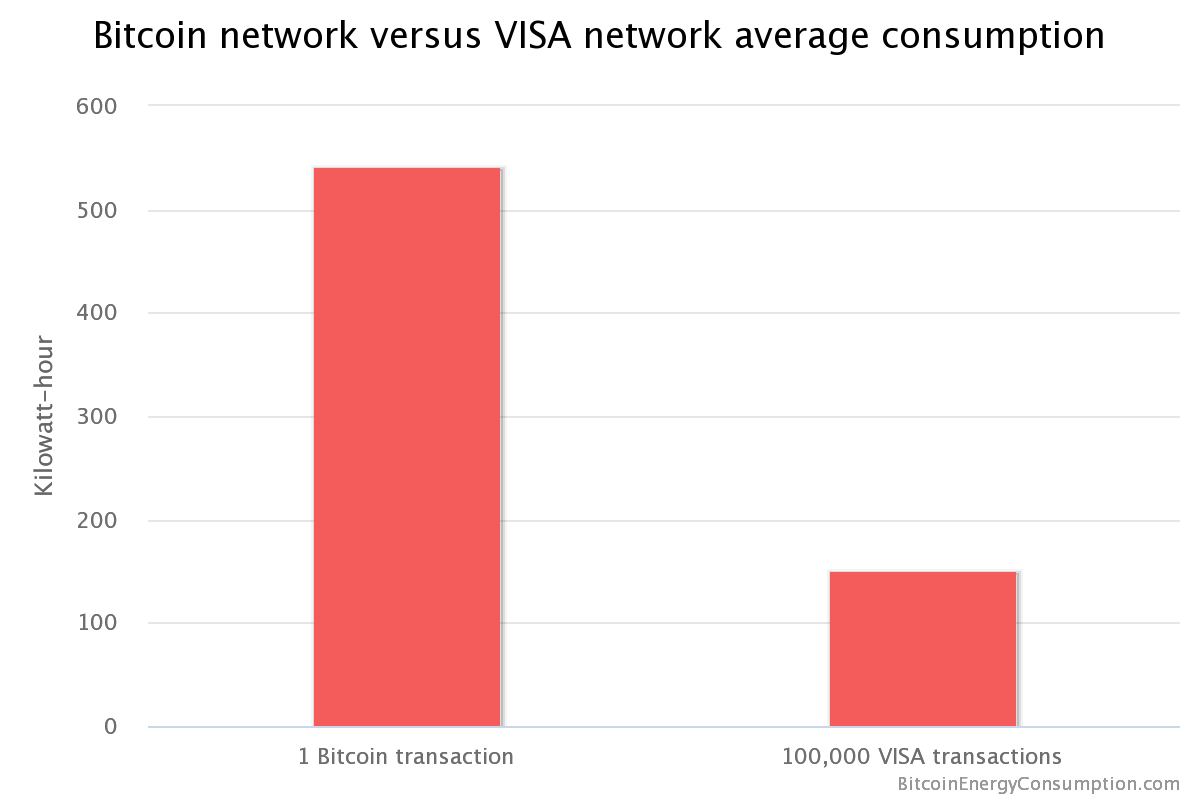
Of course, these numbers are far from perfect (e.g. energy consumption of VISA offices isn’t included), but the differences are so extreme that they will remain shocking regardless. A comparison with the average non-cash transaction in the regular financial system still reveals that an average Bitcoin transaction requires several thousands of times more energy. One could argue that this is simply the price of a transaction that doesn’t require a trusted third party, but this price doesn’t have to be so high as will be discussed hereafter.
Alternatives
Proof-of-work was the first consensus algorithm that managed to prove itself, but it isn’t the only consensus algorithm. More energy efficient algorithms, like proof-of-stake, have been in development over recent years. In proof-of-stake coin owners create blocks rather than miners, thus not requiring power hungry machines that produce as many hashes per second as possible. Because of this, the energy consumption of proof-of-stake is negligible compared to proof-of-work. Bitcoin could potentially switch to such an consensus algorithm, which would significantly improve sustainability. The only downside is that there are many different versions of proof-of-stake, and none of these have fully proven themselves yet. Nevertheless the work on these algorithms offers good hope for the future.
Energy consumption model and key assumptions
Even though the total network hashrate can easily be calculated, it is impossible to tell what this means in terms of energy consumption as there is no central register with all active machines (and their exact power consumption). In the past, energy consumption estimates typically included an assumption on what machines were still active and how they were distributed, in order to arrive at a certain number of Watts consumed per Gigahash/sec (GH/s). A detailed examination of a real-world Bitcoin mine shows why such an approach will certainly lead to underestimating the network’s energy consumption, because it disregards relevant factors like machine-reliability, climate and cooling costs. This arbitrary approach has therefore led to a wide set of energy consumption estimates that strongly deviate from one another, sometimes with a disregard to the economic consequences of the chosen parameters. The Bitcoin Energy Consumption Index therefore proposes to turn the problem around, and approach energy consumption from an economic perspective.
The index is built on the premise that miner income and costs are related. Since electricity costs are a major component of the ongoing costs, it follows that the total electricity consumption of the Bitcoin network must be related to miner income as well. To put it simply, the higher mining revenues, the more energy-hungry machines can be supported. How the Bitcoin Energy Consumption Index uses miner income to arrive at an energy consumption estimate is explained in detail here (also in peer-reviewed academic literature here), and summarized in the following infographic:

Note that one may reach different conclusions on applying different assumptions (a calculator that allows for testing different assumptions has been made available here). The chosen assumptions have been chosen in such a way that they can be considered to be both intuitive and conservative, based on information of actual mining operations. In the end, the goal of the Index is not to produce a perfect estimate, but to produce an economically credible day-to-day estimate that is more accurate and robust than an estimate based on the efficiency of a selection of mining machines.
Criticism and Validation
Over time, the Bitcoin Energy Consumption Index has been criticised by many experts, as they claimed economic models cannot be used to make accurate statements on Bitcoin’s energy consumption. But the methodology underlying the Bitcoin Energy Consumption Index has been recognised in peer-reviewed academic literature since May 2018 (the full paper can be found here). And with 2018 behind us, we can now also verify the main prediction made in the paper, based on an economic model, with a more simple approach. The economic model showed that Bitcoin’s energy consumption could grow to the same size as Austria’s electrical energy consumption. The electrical energy consumption of Austria amounts to 72 TWh per year. The paper also predicted that this level would be reached towards the end of 2018. The prediction was based on the data available on March 16, 2018, while the network’s minimum energy consumption was still equal to the electrical energy consumption of Ireland (27 TWh per year). The Bitcoin price at the time had just dropped 60% compared to the peak just several months before. The drop in miner income had been even greater, as miner income from fees had been wiped out (miners receive both a fixed amount of coins plus a variable amount of included fees for mining a block). Even so, economics showed room for further growth of the network’s energy consumption continued to exist despite these facts. A simple bottom-up approach can now be applied to verify that this indeed happened.
As 2018 progressed, the total network hashrate continued to climb from around 25 exahashes per second at the time of the prediction (March 16, 2018), to a peak of 56.8 exahashes per second that was reached at the start of the fourth quarter of 2018. At the efficiency level of the most used and most efficient machine at the time, Bitmain’s Antminer S9 (0.098 Joule per gigahash), this translates to 49 TWh per year. This obviously does not account for less efficient machines in the network and, more importantly, the number is not corrected for the Power Usage Effectiveness (PUE) of Bitcoin mining facilities. These facilities require significant cooling capacities (not reflected in the network’s computational power), and therefore their PUE could easily be around 1.25 as motivated in the same paper. Applying this as a correction factor to the 49 TWh mentioned before, we find that the Bitcoin network must have been consuming at least 61 TWh.
Another correction would be required for the simple fact that Bitmain (with a claimed market share of around 70%) is not the sole producer of Bitcoin mining machines, and for the fact that they were also selling less efficient (but more stable) Bitcoin mining machines like the Antminer T9 (which requires more than 25% more power than the Antminer S9 per gigahash of computational power). The best machines of Bitmain’s competitors required at least 10% more power than the Antminer S9 per gigahash of computational power. It should therefore be clear that a bottom-up approach, that properly includes these required corrections, would be highly unlikely to find an energy consumption below 72 TWh per year (and certainly not significantly lower) at the start of Q4 2018. This provides strong support for using the economic model underlying the Bitcoin Energy Consumption Index for creating both live and predictive (which is completely impossible based solely on a bottom-up approach) estimates of Bitcoin’s energy consumption.
Forecasting
Of course, the Bitcoin Energy Consumption Index is also very much a prediction model for future Bitcoin energy consumption (unlike hashrate-based estimates that have no predictive properties). The model predicts that miners will ultimately spend 60% of their revenues on electricity. At the moment (January 2019), miners are spending a lot more on electricity. On January 22, 2019, the Bitcoin Energy Index was estimating that 100% of miner revenues ($2.3B) were actually spent on electricity costs. This can happen after a significant drop in mining revenues where mining becomes generally unprofitable. In this situation machines are removed from (rather than added to) the network. Since machine investments can be considered sunk costs (no longer relevant to the decision to continue mining), miners will continue to run their machines up until the point where the electricity costs exceed the amount of mined income (approaching 100%).
Based on 100% of revenues already being used to cover electricity expenses, the Energy Consumption Index would thus predict little change in Bitcoin’s energy consumption.
Recommended Reading
The Bitcoin Energy Consumption Index is the first real-time estimate of the energy consumed by the Bitcoin network, but certainly not the first. A list of articles that have focussed on this subject in the past are featured below. These articles have served as an inspiration for the Energy Index, and may also serve as a validation of the estimated numbers.
Source : https://digiconomist.net/bitcoin-energy-consumption